41% of executives still view L&D as a cost rather than an investment, even as U.S. corporate training spend hit $102.8 billion in 2025 (Source: TalentLMS L&D Report, 2026; Training Magazine, 2025). The money is there. The credibility isn't.
That gap isn't a budget problem, it's an architecture problem. Programmes designed around completions and satisfaction scores will always look like overhead to a CFO. Programmes designed around four specific business outcomes will not. A Learning & Development LMS is the operational infrastructure that connects training activity directly to workforce performance data, using a four-layer framework.
75% of HR managers say their strategy is aligned with business KPIs (Source: TalentLMS L&D Report, 2026), yet 41% of executives still see L&D as a cost. The gap comes down to measurement: programmes tracked by completions and satisfaction scores will always look like overhead, because those metrics don't speak the language of business performance.
An L&D team that delivers 94% course completion still gets asked whether sales numbers improved, with no data connecting the two. That's not a reporting failure, it's a design failure: the fix is building a clear line of sight to outcomes from the start.
The L&D Strategy Stack is OOOLAB's four-layer framework for building an L&D function that produces measurable business results, with each layer mapping directly to a platform capability so strategy and your Learning & Development LMS operate as one system.
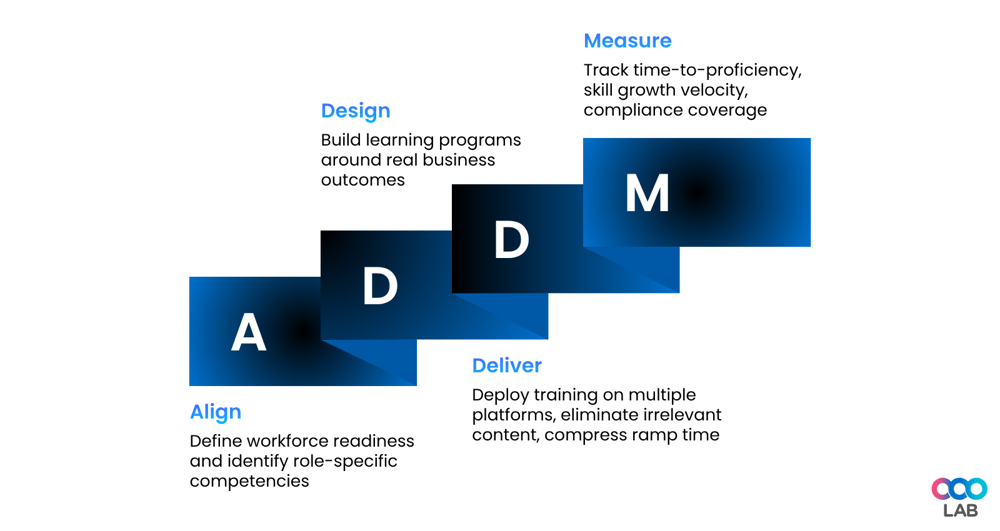
Here's how each layer works:
Layer 1 - Align: Define workforce readiness as a measurable outcome and establish your competency baseline before training is designed.
Layer 2 - Design: Build programmes around the outcomes you need to move, like retention and internal mobility, not content availability.
Layer 3 - Deliver: Deploy training through a platform that meets employees where they are, with personalised paths that compress ramp time.
Layer 4 - Measure: Track time-to-proficiency, skill growth velocity, and compliance coverage, not completion rates.
Built for L&D leaders who need results, not more admin. Book your free demo and bring your learning operations up to speed.
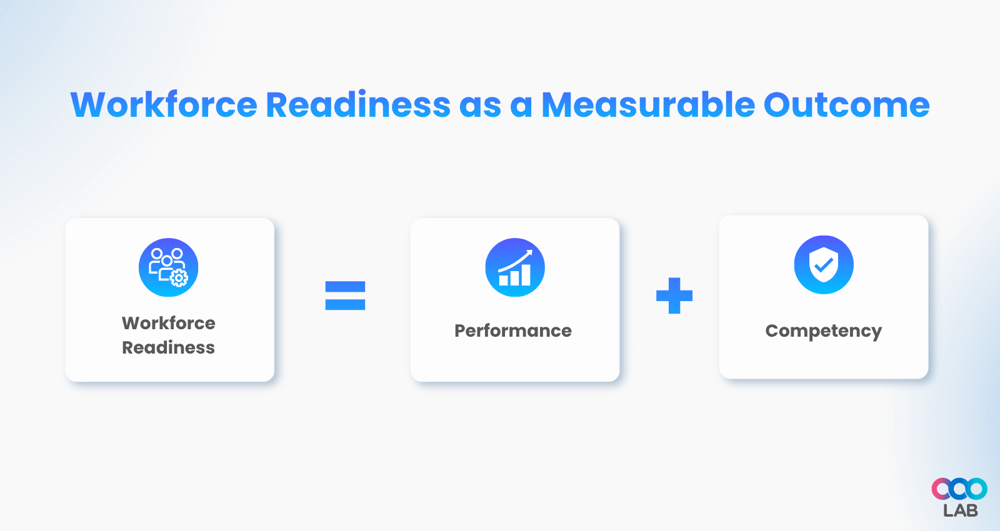
Workforce readiness is a business metric, not a training goal: the percentage of your workforce performing at the competency level their role requires. A Capability LMS makes this visible by tracking skill gap assessments, competency completion, and time-to-proficiency by role, not just course completion.
63% of employers cite skills gaps as the biggest barrier to business transformation (Source: Training Orchestra, 2026), and in most organisations it's a visibility problem, not a hiring one. When an L&D director finds 40% of new hires missing baseline proficiency within 60 days, the right LMS analytics turn that anecdote into an actionable finding, pinpointing exactly which modules and cohorts are falling behind.
Read more
>>> Competency vs. Skill-Based Learning: How an LMS Can Help
>>> The Role of an LMS in Corporate Learning & Development Strategies
Retention and L&D strategy aren't separate programmes. 90% of employees are more likely to stay at a company that invests in their growth (Source: LinkedIn Workplace Learning, 2025), and organisations with strong learning cultures see 30-50% higher retention (Source: Clarity Consultants/Brandon Hall Group, 2026). Your Professional Development LMS architecture is a direct input to that number.
Designing for retention means building visible development paths, not just assigning courses, so employees can see what roles and certifications their learning leads toward. A platform with structured career pathways and internal mobility tracking turns L&D from a training calendar into a career architecture.
Read more
>>> How a Professional Development LMS Supports Career Growth
New hire ramp time and internal transfer transition cost are among the most quantifiable, and most underreported, L&D impact areas. Every week a new employee isn't at full productivity is a cost. The Deliver layer is where your AI LMS reduces both.
LearningOS clients report 40-60% less training time than traditional delivery, through AI-assigned paths based on role, prior competency, and skill gaps that cut the irrelevant modules generic course catalogues add. Track completion velocity, first-attempt pass rates, and manager-confirmed readiness against your onboarding timeline to make this measurable.
Read more
>>> Measuring Training Impact Using an Enterprise LMS
>>> Why a Learning & Development LMS is Essential for Modern Workforce Training
Compliance training isn't just a legal obligation, untracked compliance is a quantifiable financial risk. The right frame for leadership isn't course completion rates, it's reduced regulatory exposure with an audit trail to prove it.
That reframe positions L&D as a risk management function, a budget case that survives any downturn. LearningOS is SOC 2 Type 2 and ISO 27001 certified, meeting the same compliance bar it helps your organisation achieve. Track certification expiry, overdue alerts, and audit-ready, timestamped reporting to convert compliance training into risk-reduction evidence.

Each layer maps to a specific LearningOS capability: Align uses competency frameworks and skill gap assessments, Design uses personalised career pathways, Deliver uses the Virtual Learning Environment and Mobile Learner Portal, and Measure uses the analytics dashboard linking training to performance.
The result is one platform, one learner record, and one line of sight from training activity to outcome. Organisations aligning L&D around skills see up to 40% higher productivity (Source: McKinsey), with LearningOS clients reporting $3.5 ROI on every dollar invested and 30-50% higher retention.
Read more
>>> Data-Driven Training: Transforming Skill Quotient Development with Analytics
L&D's shift from cost centre to capability engine is a design question, not a budget one. Organisations achieving it build platforms around business outcomes, not training delivery. The four-layer L&D Strategy Stack gives your team the architecture, and the language, to make that case before your next budget review.
Built for L&D leaders who need results, not more admin. Book your free demo and bring your learning operations up to speed.
At OOOLAB (pronounced "uːlæb"), our mission is to make complex learning operations simple. We aim to positively impact the lives of over 1,000,000 learners and educators by the end of 2026. OOOLAB's LearningOS provides educational institutions and corporate enterprises with an all-in-one solution to create and deliver engaging learning experiences.
Dedicated success manager
Personalized setup
Ongoing assistance
Learn more at thelearningos.com
What is the difference between an L&D strategy and a Learning & Development LMS?
An L&D strategy is the plan - it defines which business outcomes training should move, which competencies need building, and how progress will be measured. A Learning & Development LMS is the infrastructure that executes that plan at scale. Without a strategy, an LMS is a content warehouse. Without an LMS, a strategy has no operational engine. The two work together: strategy defines the outcomes, the platform tracks and delivers them.
What are the four layers of an effective L&D strategy?
An effective L&D strategy built around business outcomes has four layers. Align defines workforce readiness as a measurable competency metric. Design builds programmes around retention and career development outcomes. Deliver deploys personalized learning paths that compress time-to-productivity. Measure tracks compliance coverage and performance data that leadership can act on. Together, these layers form the L&D Strategy Stack - a framework that connects every training decision to a business result.
How does a Learning & Development LMS reduce employee turnover?
A Learning & Development LMS supports retention by making development visible. When employees see structured career pathways, track progress toward certifications, and access learning for their next role - not just their current one - they're significantly more likely to stay. Research from LinkedIn Workplace Learning (2025) shows that 90% of employees are more likely to remain at companies that invest in their growth. The LMS is the infrastructure that makes that investment visible and measurable.
What is time-to-productivity and how do you measure it with an LMS?
Time-to-productivity is the period between a new hire's start date and the point at which they're performing at the competency level their role requires. It's one of the most direct measures of onboarding effectiveness - and one of the easiest to quantify in financial terms. An LMS measures it by tracking completion velocity, first-attempt assessment pass rates, and manager-confirmed readiness sign-offs against a defined role benchmark. LearningOS clients report 40–60% less training time, which directly compresses this metric and reduces the cost of every new hire and internal transfer.
How can L&D leaders prove training value to leadership before the budget review?
The most effective approach is to design programmes around business outcomes from the start - not to retrospectively map training activity to results. That means selecting four to five KPIs leadership already tracks - retention rate, time-to-productivity, compliance coverage, productivity improvement - and configuring your LMS to surface data against each from day one. When the budget conversation arrives, you're presenting outcome data, not activity reports. Organisations aligning L&D around measurable skills see up to 40% higher productivity (Source: McKinsey) - the kind of metric that secures budgets rather than defends them.