Companies that invest in learning and development are 79% more likely to meet their business goals (Source: Project Management Institute). And yet, when budget season arrives, L&D teams are often the first to face scrutiny - because they struggle to speak in the language of the people holding the purse strings.
The problem is not a lack of data. Most enterprise LMS platforms generate more training data than teams know what to do with. The problem is tracking the wrong things. Completion rates tell you whether employees opened a course - not whether they are selling more, staying longer, or making fewer mistakes. This article explores how to map L&D programs to measurable business outcomes, using a practical framework and the language executives respond to, supported by data-driven insights.
Most L&D measurement fails because it tracks activity, not outcomes. Only 13% of companies evaluate the ROI of their L&D programs, despite 92% of employees reporting that training positively influences their engagement (Source: LinkedIn Workplace Learning, 2025). That gap is a measurement strategy problem, not a technology problem.
The three most common failure points are predictable:
Tracking course completions instead of behavior change: knowing 400 employees finished a compliance module tells you nothing about whether compliance incidents have decreased.
Measuring learner satisfaction instead of time-to-proficiency: a high satisfaction score on an onboarding course does not mean new hires are productive faster.
Reporting training volume instead of performance KPIs: hours of training delivered is a cost metric dressed up as an impact metric.
The fix is not more data. It is better-aligned data, traced back to a specific business goal.
Read more
>>> How to Track Learning Outcomes and ROI with an LMS
Before opening your LMS dashboard, you need a mapping layer that connects each training program to a specific business goal. Use this table before a program launches to align stakeholders, and after delivery to structure your reporting.
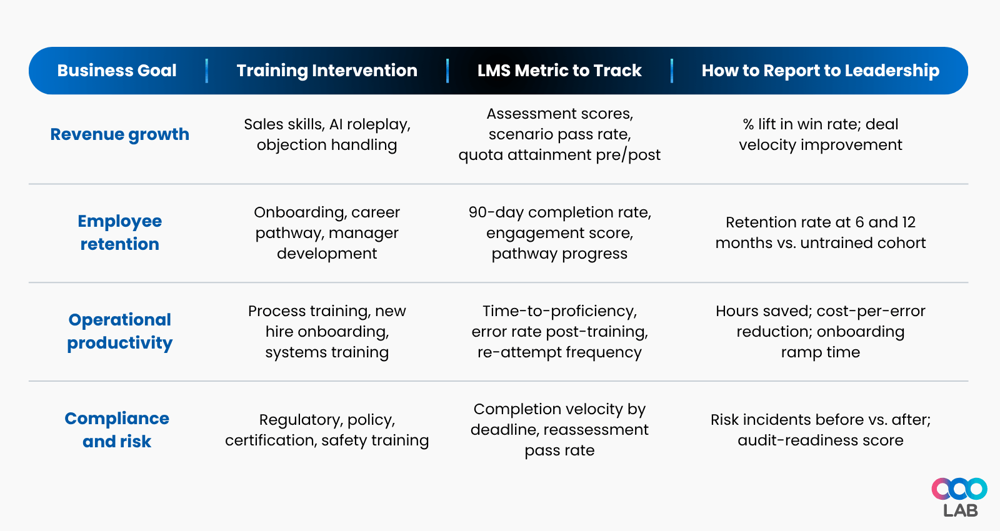
The discipline is in step one: identify the business goal before content is built. When training is designed backward from a business goal, measurement becomes straightforward. When it is designed forward from a content brief, measurement becomes guesswork.
Bring your Training and Learning to a new height. Book a Free Demo with LearningOS.
Companies with structured sales training programs achieve 78% quota attainment vs. 63% for non-adopters (Source: RAIN Group). That 15-point gap is a training gap. Skill Quotient OS, OOOLAB's AI-powered roleplay and assessment tool, generates the competency data that bridges training completion to revenue outcomes.
90% of employees are more likely to stay at a company that invests in their professional growth (Source: LinkedIn Workplace Learning, 2025). Track 6-month and 12-month retention rates of employees who completed structured pathways against those who did not. LearningOS clients report 30-50% higher employee retention after deploying structured learning pathways.

Organizations that align L&D programs around measurable skills see up to 40% higher productivity (Source: McKinsey). LearningOS clients report 40-60% less training time required to reach the same proficiency levels, translating directly into reduced labor costs. Track error rate post-training to build the second half of your productivity ROI story.
Non-compliance costs are not abstract. The metrics that matter are completion velocity by deadline, reassessment pass rate, and audit trail completeness. LearningOS is SOC 2 Type 2, ISO 27001, and GDPR certified, with the audit trail built in, not bolted on.
Read more
>>> Analytics Tools That Connect LMS Data to Business Results
>>> How to Measure Skill Quotient and Competency Assessment
To present training ROI to the C-suite, reframe every learning metric as a business metric. Replace completion rate with employees certified and deployment-ready. Replace satisfaction score with onboarding-related attrition reduction at 90 days.
Organizations using LMS platforms report 42% higher ROI on training compared to traditional methods (Source: eLearning Industry). LearningOS clients report an average $3.5 return on every dollar invested, typically realized within 6-12 months. When you present those figures alongside cohort data from your LMS, training stops looking like a cost center.
The teams that survive budget scrutiny are not the ones with the most sophisticated training programs. They are the ones who walk into a budget meeting with a one-page summary that connects every training investment to a line on the P&L.
Learning Language | Business Language |
85% completion rate | 340 employees certified and deployment-ready |
Learner satisfaction: 4.2/5 | Net reduction in onboarding-related attrition at 90 days |
12-hour course reduced to 6-hour blended format | Estimated $X saved in lost productivity across 500 employees |
Assessment pass rate improved by 22% | Post-training error rate down 31% in Q3 |
The L&D teams that earn credibility with leadership are not the ones with the most content. They are the ones who can show, with data, how training moved a business number. Start with one program. Pick one business goal from the table above. Configure your LMS to track the corresponding metrics. Pull the before/after at 90 days. That one data point, presented in business language, is worth more to your budget than a hundred satisfaction surveys.
Curious what an all-in-one LMS actually looks like in practice? Book a walkthrough — no commitment, just clarity.
At OOOLAB (pronounced "uːlæb"), our mission is to make complex learning operations simple. We aim to positively impact the lives of over 1,000,000 learners and educators by the end of 2026. OOOLAB's LearningOS provides educational institutions and corporate enterprises with an all-in-one solution to create and deliver engaging learning experiences.
Dedicated success manager
Personalized setup
Ongoing assistance
Learn more at thelearningos.com
1. What L&D metrics does the C-suite care about?
C-suite leaders care about metrics that connect directly to business performance: revenue impact (win rate, deal velocity), employee retention rates, operational productivity (time-to-proficiency, error rate reduction), and compliance incident frequency. Completion rates and satisfaction scores are internal L&D metrics - they are not meaningful to a CFO or COO without a clear line to one of those business outcomes.
2. How do you calculate training ROI?
The standard formula is: (Financial benefit from training minus cost of training) divided by cost of training, multiplied by 100. The practical challenge is isolating the financial benefit. An LMS closes this gap by connecting training completion data to downstream performance data - for example, correlating sales training completion with post-training quota attainment pulled from your CRM.
3. What is a good ROI for corporate training?
Industry benchmarks put the average return on training investment at approximately 3x. LearningOS clients report $3.5 returned for every dollar invested, typically realized within 6-12 months of deployment. The figure varies by industry and program type: compliance training ROI is typically realized in risk cost avoidance, while sales training ROI is most visible in revenue metrics.
4. How does an LMS measure training effectiveness?
An LMS measures training effectiveness by centralizing completion data, assessment scores, time-to-proficiency, and learner engagement metrics in a single dashboard. When integrated with HRIS or CRM systems, it connects those learning metrics to downstream business performance, making it possible to correlate a completed sales training module with the following quarter's win rate.
5. What is the difference between training outputs and training outcomes?
Training outputs are activity metrics: courses completed, hours logged, learners enrolled. Training outcomes are the downstream business results those activities were designed to influence: faster onboarding, higher retention, lower compliance risk, improved sales performance. The L&D teams that earn C-suite confidence are the ones who report outcomes, not outputs, and who have the LMS data to back them up.